Joomla User Manual
Manual Index
Visual Studio Code Primer
VS Code - A Popular Free IDE
From Wikipedia:
Visual Studio Code, also commonly referred to as VS Code, is a source-code editor made by Microsoft for Windows, Linux and macOS. Features include support for debugging, syntax highlighting, intelligent code completion, snippets, code refactoring, and embedded Git. Users can change the theme, keyboard shortcuts, preferences, and install extensions that add additional functionality.
Installation
The VS Code site default page has a drop-down list for each supported platform. The chances are that your platform is pre-selected. So download and install and you are ready to go.
Getting Started
The VS Code Get Started page has some Start items, a list of Recent items, and a short list of Walkthroughs. If you are completely new to VS Code these are recommended viewing. They only take a few minutes.
The VS Code Documentation is available from the Help / Documentation menu. The Introductory Videos are well worth viewing. Each takes 2 to 6 minutes and give an excellent introduction to VS Code features.
The official documentation is the place to go to if you want to look up specific information.
VS Code Extensions
VS code can be used for any type of text, including a wide range of programming languages. It works with JavaScript without adding extensions. Other languages are detected by context so if you start creating and saving PHP code you are likely to be prompted to install a PHP Support pack.
Click on the Extensions icon in the left Activity Bar to see what you have installed and what is recommended. You will need the PHP Debug extension!
The VS Code Screen Layout
Some terms used in subsequent instructions:
- Activity Bar the narrow bar at the left of the screen. Select any icon to open or close the Primary Sidebar.
- Primary Side Bar when open shows details of the selected activity.
- Status Bar at the bottom of the screen. It shows what is going on.
- Panel an area beneath the text editors to display other information.
Select a layout icon at the top right to open or close any one of these items.
Coding a Joomla Extension
To create an extension your objective is to create a zip file that you can install in a working Joomla site. So you need a folder to contain your code. This should be within your personal file space on your laptop or desktop computer used for local development. It should not be in your website tree. For example you could use ~/jextensions to contain subfolders for different extensions. I use ~/git because it is short and easy to spell although potentially confusing because each subfolder uses a separate git repository.
Sample Code
If you would like some sample code to work on there is an extension available on GitHub named mod_debugme. As the name implies, it is a module with some bugs. In addition to the module code there is a build.xml file to illustrate one way to automate building for testing and creating a zip file.
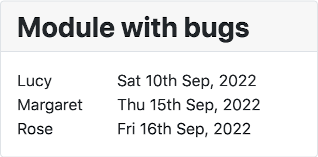
The module is designed to show the next few (3 by default) events (birthdays) from a list stored in a database table. You might imagine this being used in an office or family site in the expectation of cake.
It may be best to get going by using git commands from the command line. First create a folder for your code and then clone the remote repository:
    mkdir ~/git
    cd ~/git
    git clone https://github.com/ceford/j4xdemos-mod-debugme
The response should take just a few seconds:
    Cloning into 'j4xdemos-mod-debugme'...
    remote: Enumerating objects: 23, done.
    remote: Counting objects: 100% (23/23), done.
    remote: Compressing objects: 100% (16/16), done.
    remote: Total 23 (delta 3), reused 23 (delta 3), pack-reused 0
    Unpacking objects: 100% (23/23), done.
You should take a moment to look at the contents of the folder:
    cd j4xdemos-mod-debugme
    ls -al
    total 16
    drwxr-xr-x   6 ceford  staff   192  2 Sep 17:48 .
    drwxr-xr-x   3 ceford  staff    96  2 Sep 17:48 ..
    drwxr-xr-x  12 ceford  staff   384  2 Sep 17:48 .git
    -rw-r--r--   1 ceford  staff  1402  2 Sep 17:48 README.md
    -rw-r--r--   1 ceford  staff   927  2 Sep 17:48 build.xml
    drwxr-xr-x   8 ceford  staff   256  2 Sep 17:48 mod_debugme
The .git folder contains information about the repo. The README.md file is a markdown document that describes this repo. The build.xml file is a file used to build the extension with an external tool, Phing - described later. The mod_debugme folder contains the code of the extension.
Install in Joomla
Compress the extension folder to create an installable zip file:
zip -r mod_debugme.zip mod_debugme
You can now install the zip file in the Joomla site you use for testing. After installation you need to create a Site module and assign it to a module position. As it is a broken module you could assign it to a position on All pages while you work on it; or you could assign it to a position on a single page; or you could position it in an article that has its own menu item.
After installation, delete the zip file.
Turn on Debug Mode
In Joomla's Global Configuration, set Debug System to Yes and Error Reporting to Maximum.
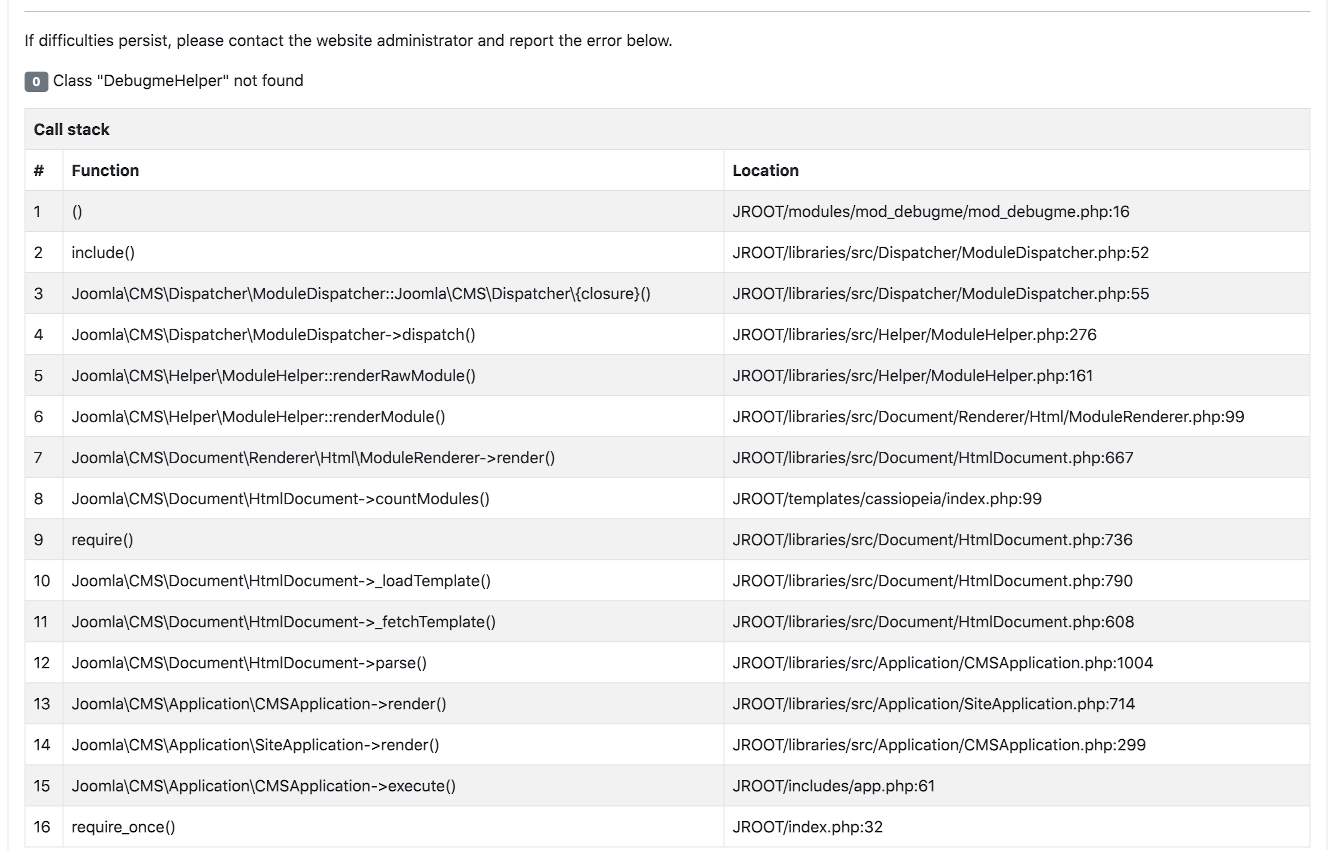
When you open a page containing the buggy module you will see a stack trace telling you where an error was triggered.

Sometimes the coding error is on the first line of the stack trace. Otherwise, if the error is triggered in library code, for example by passing invalid data to a database function, the coding error may be further down the list of function calls.
Open Extension Folder in VS Code
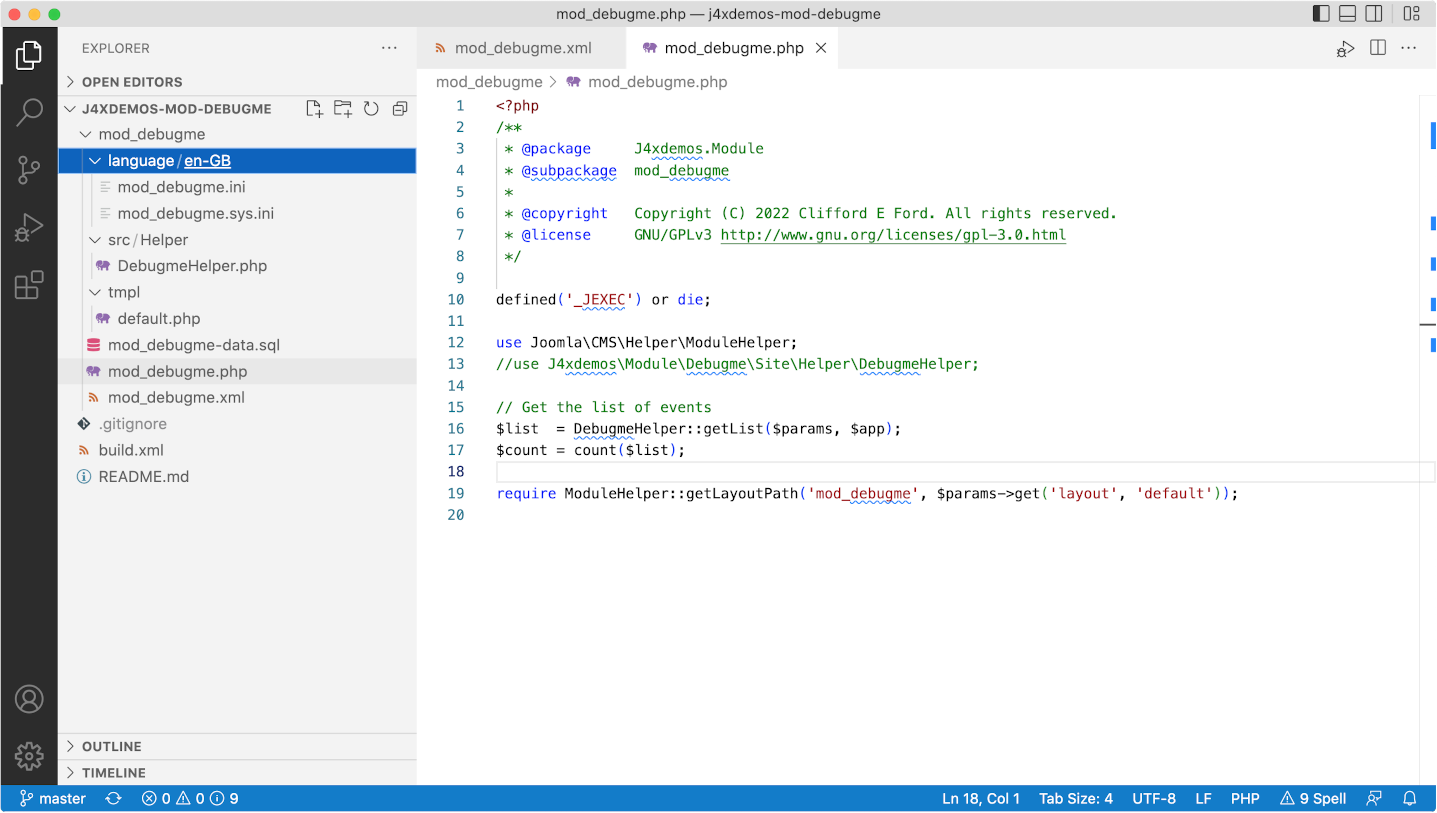
In VS Code, use the File / Open Folder menu item to locate and open the folder containing your local copy of the mod_debugme extension code. You should see something similar to the following:

You may be able to diagnose the problem just by reading the code. In the case of the Class "DebugHelper" not found error you will see that a use statement has been commented out a few lines previously. Forgetting to insert a use statement is a common error during initial development!
Fix that problem and then compress and install the module again. That step gets a bit tedious when you have multiple problems. Which is where build tools come in useful.
Phing
Phing is a command line tool, available for all platforms, used to build software packages using instructions stored in an xml file, named build.xml by default. For working with extension code it can be used to do two things:
- copy changed files from your extension source folder to the correct places in your website folder.
- generate a new zip file for new installations.
Download and install Phing. Other build tools are available! You could install Phing in your own bin folder or in a system bin folder. You need to note the path to your Phing code. In this example it is ~/bin/phing-latest.phar. You can try it out from the command line after changing into the folder containing your extension code:
    cd ~/git/j4xdemos-mod-debugme
    php ~/bin/phing-latest.phar
Response:
    Buildfile: /Users/ceford/git/j4xdemos-mod-debugme/build.xml

    mod_debugme > main:
          ... Any copied files will be mentioned here
          [zip] Building zip: /Users/ceford/zips/mod_debugme.zip

    BUILD FINISHED

    Total time: 0.0863 seconds
VS Code Tasks
To run Phing from within VS Code you need to create a tasks.json file in the .vscode folder in the root of the j4xdemos-mod-debugme folder. If the latter does not exist, first create it. Then create the tasks.json file and enter the following code:
    {
        // See https://go.microsoft.com/fwlink/?LinkId=733558
        // for the documentation about the tasks.json format
        "version": "2.0.0",
        "tasks": [
          {
            "label": "Build mod_debugme",
            "type": "shell",
            "command": "php ~/bin/phing-latest.phar",
            "windows": {
              "command": "php ~/bin/phing-latest.phar"
            },
            "group": "build",
            "presentation": {
              "reveal": "always",
              "panel": "shared"
            }
          }
        ]
    }
Windows users need to fix the Windows-specific command. You can now build the extension using the menu Terminal / Run Build Task. The result of the command should appear in the Terminal Panel beneath the Edit area.
      *  Executing task: php ~/bin/phing-latest.phar

    Buildfile: /Users/ceford/git/gitdemo/j4xdemos-mod-debugme/build.xml

    mod_debugme > main:

          [zip] Nothing to do: /Users/ceford/zips/mod_debugme.zip is up to date.

    BUILD FINISHED

    Total time: 0.1031 seconds

     *  Terminal will be reused by tasks, press any key to close it.
There may be incomprehensible error messages. The most likely cause is in having invalid paths to folders in the build.xml file or a folder has not been created. Just another sort of problem to debug!
Debugging
You should be able to fix the first bug by code inspection. More complicated problems require stepping though the code with the debugger. That allows you to inspect variables to see if they contain values that you expect, for example when passing arguments to library functions.
php.ini Settings
To set up debugging with Xdebug you need to make some entries at the top of your php.ini file.
    zend_extension="xdebug.so"
    xdebug.mode="debug"
    xdebug.client_port=9003
    xdebug.start_with_request = yes
After saving any changes, restart your Apache server.
Add Website Window
Your extension folder contains just a few files, the sources of the files installed in your website. Runtime debugging involves setting breakpoints in your site files so you need access to those files. You could use the File / Add Folder to Workspace... menu to add the site folder to your Workspace. However, there is a very good chance you will end up making changes to site files instead of source files. So it is probably best to open a separate VS Code window for debugging.
- Open new window: From the VS Code menu, select File / New Window and select the folder containing your Joomla website.
- Open folder: In the newly opened window, select File / Open Folder... from the VS Code menu. Find your website folder and select it. You should see a list of all the files in your Joomla website in the Primary sidebar.
Launch Configuration
For debug to actually work in VS Code you need a launch configuration. In the root of your website create a folder named .vscode (note the leading stop) containing a file named launch.json with the following content:
    {
        "configurations": [
            {
                "name": "Listen for XDebug",
                "type": "php",
                "request": "launch",
                "hostname": "0.0.0.0",
                "port": 9003,
                "stopOnEntry": true,
                "pathMappings": {
                    "/Users/ceford/Sites/j421rc2": "${workspaceFolder}"
                }
            }
        ]
    }
Remember to replace the pathMappings item in this example with the actual pathMappings on your own site. The stopOnEntry item will pause execution on the very first line of PHP code executed.
Debug mod_debugme
Now you are ready to find and fix the bugs in the installed module.
- Find module code: Find the first bug on line 16 of JROOT/modules/mod_debugme/mod_debugme.php.
- Set breakpoint: Click in the space to the left of the number 16. A pale red blob will appear as you hover and turn full red after you click to indicate a break point has been set.
- Start debug: From the VS Code menu select Run / Start Debugging. In your browser reload your site. Your VS Code window should reappear with the code stopped at the first line of the site index.php file. At the top of the screen are some icons to control the debug process. They should be self-explanatory. If not, look them up in the VS Code Help / Documentation.
- Continue: Select the continue button - the code will run on to your first breakpoint. Examine the code to see what the problem is.
- Hover: If you hover over a variable that has been assigned a value a small Tooltip will appear summarizing that variables attributes. There is no Tooltip for variables that have not been assigned values.
- Variables: The left column contains more information about the state of the code at the breakpoint. There are too many to cover here. Explore them as required!
- Stop Debugging: It is probably best to select the Continue icon, otherwise the web page is delivered blank. Otherwise you could use the Stop button or the Run / Stop Debugging menu.
Fix a Bug
Remember: Do not fix the bug in the website code! Fix it in the source code!
Fix the source code and then use Terminal / Run Build Task....
Restart debug.
Tips
A few not so obvious problems:
- You fix the first bug but it sill crashes on that line. Look in mod_debugme.xml to see where the src of namespaced classes is defined. When fixed in the source you need to reinstall the zip file or delete administrator/cache/autoload_psr4.php. When absent, Joomla rebuilds that file from manifest files. But if it has an incorrect or missing entry it does not get fixed until the extension is reinstalled.
- Sometimes you need to set a breakpoint a few lines before the line where the error occurs, especially if you wish to check values passed to function calls.
- Table xxx.yyy\debugme doesn't exist. Ah yes, the code to create a table on install and remove on uninstall was never created. You will need to run an sql query in phpMyAdmin using the content of the mod\debugme.sql file. Remember to change #\ in the table names for your database prefix. And when it still fails check the table name in the code.
Screenshot
When all is fixed this is what you might see:

Cake days?
References
From Joomla! Documentation: Visual Studio Code also covers configuration of other tools, for example CodeSniffer and PHPUnit.