Joomla User Manual
Manual Index
Monitoring Server Health
Even if you have a fantastically optimised website, if the server that it is hosted on is not performing well, it will not load well for your visitors. Therefore it is recommended even if you are on shared hosting, that you use one of the many systems which allow you to track uptime, response time and ideally alert you in the event of problems. Pingdom has a free trial that does that for one site – ideal for keeping track of your site.
Monitoring Server Health in Google Analytics
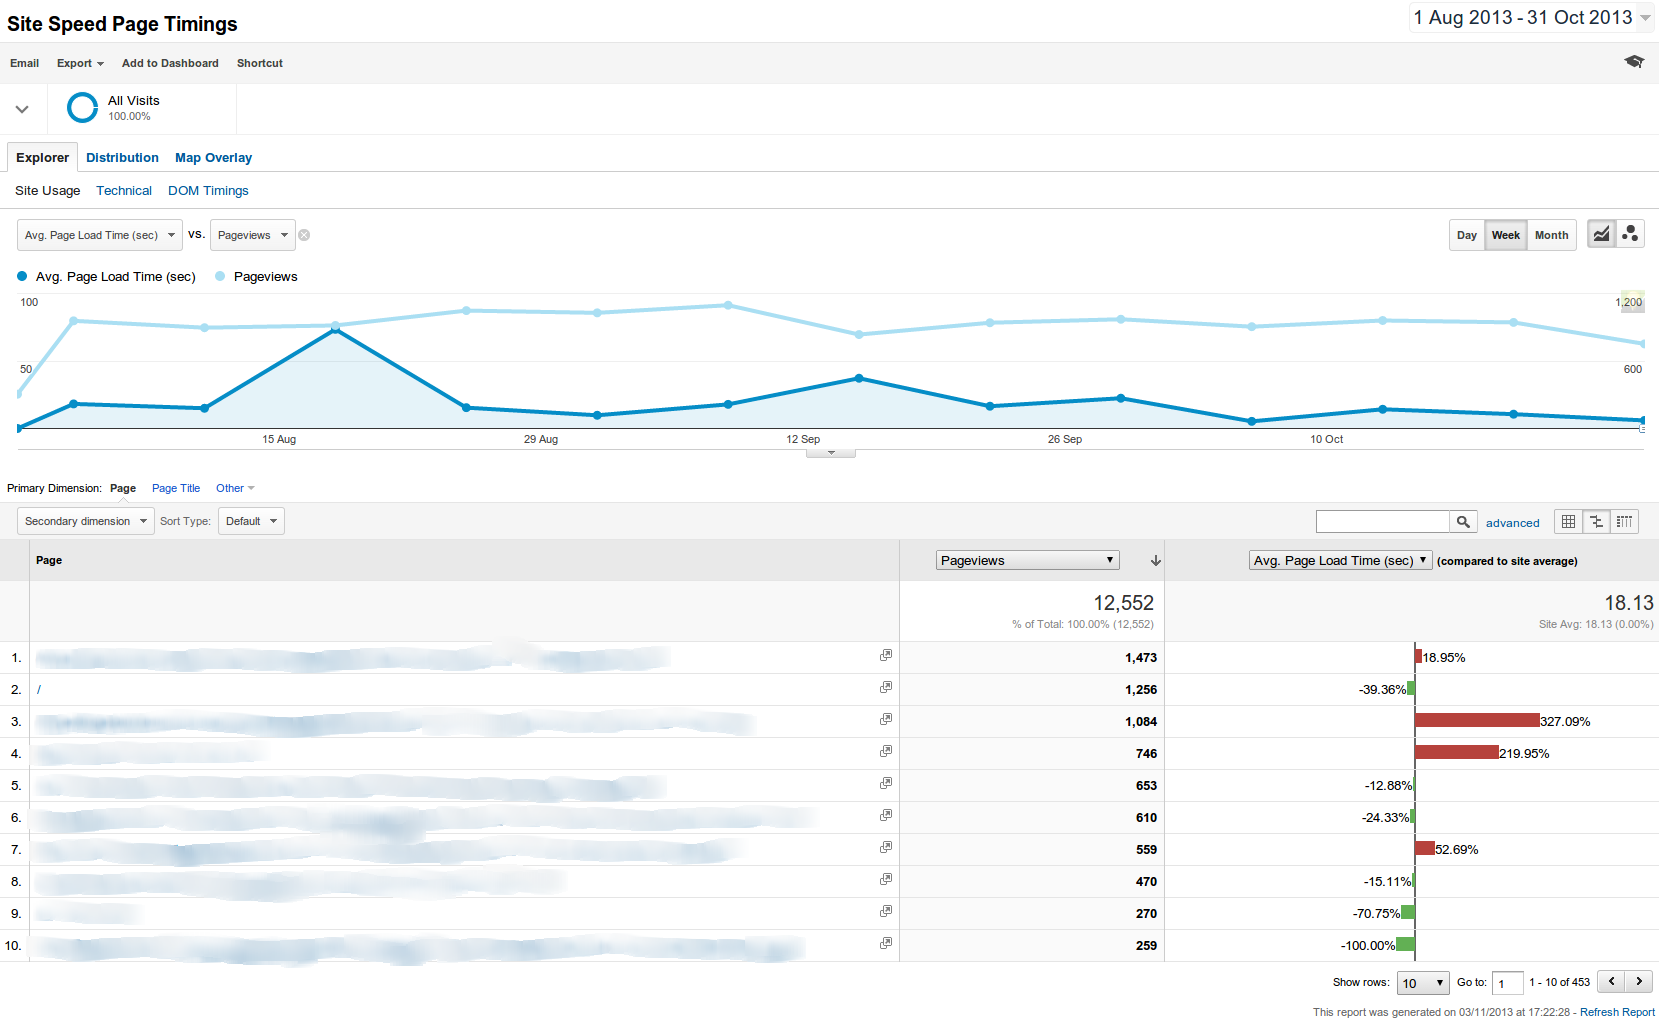
You can also view the server response time in Google Analytics and track it over time. In this case we can see some significant increases in response time (which would translate as the sites on the server loading slowly) and also some significant improvements, which would result in a better loading time. If you look at the chart over time, you should be able to associate some of the lumps and bumps with things which have happened – such as in this case moving to a faster hosting environment, experiencing a Denial of Service attack, high load due to celebrity sharing a site hosted on the server, and reducing load as high-use clients are offloaded onto their own hosting servers.

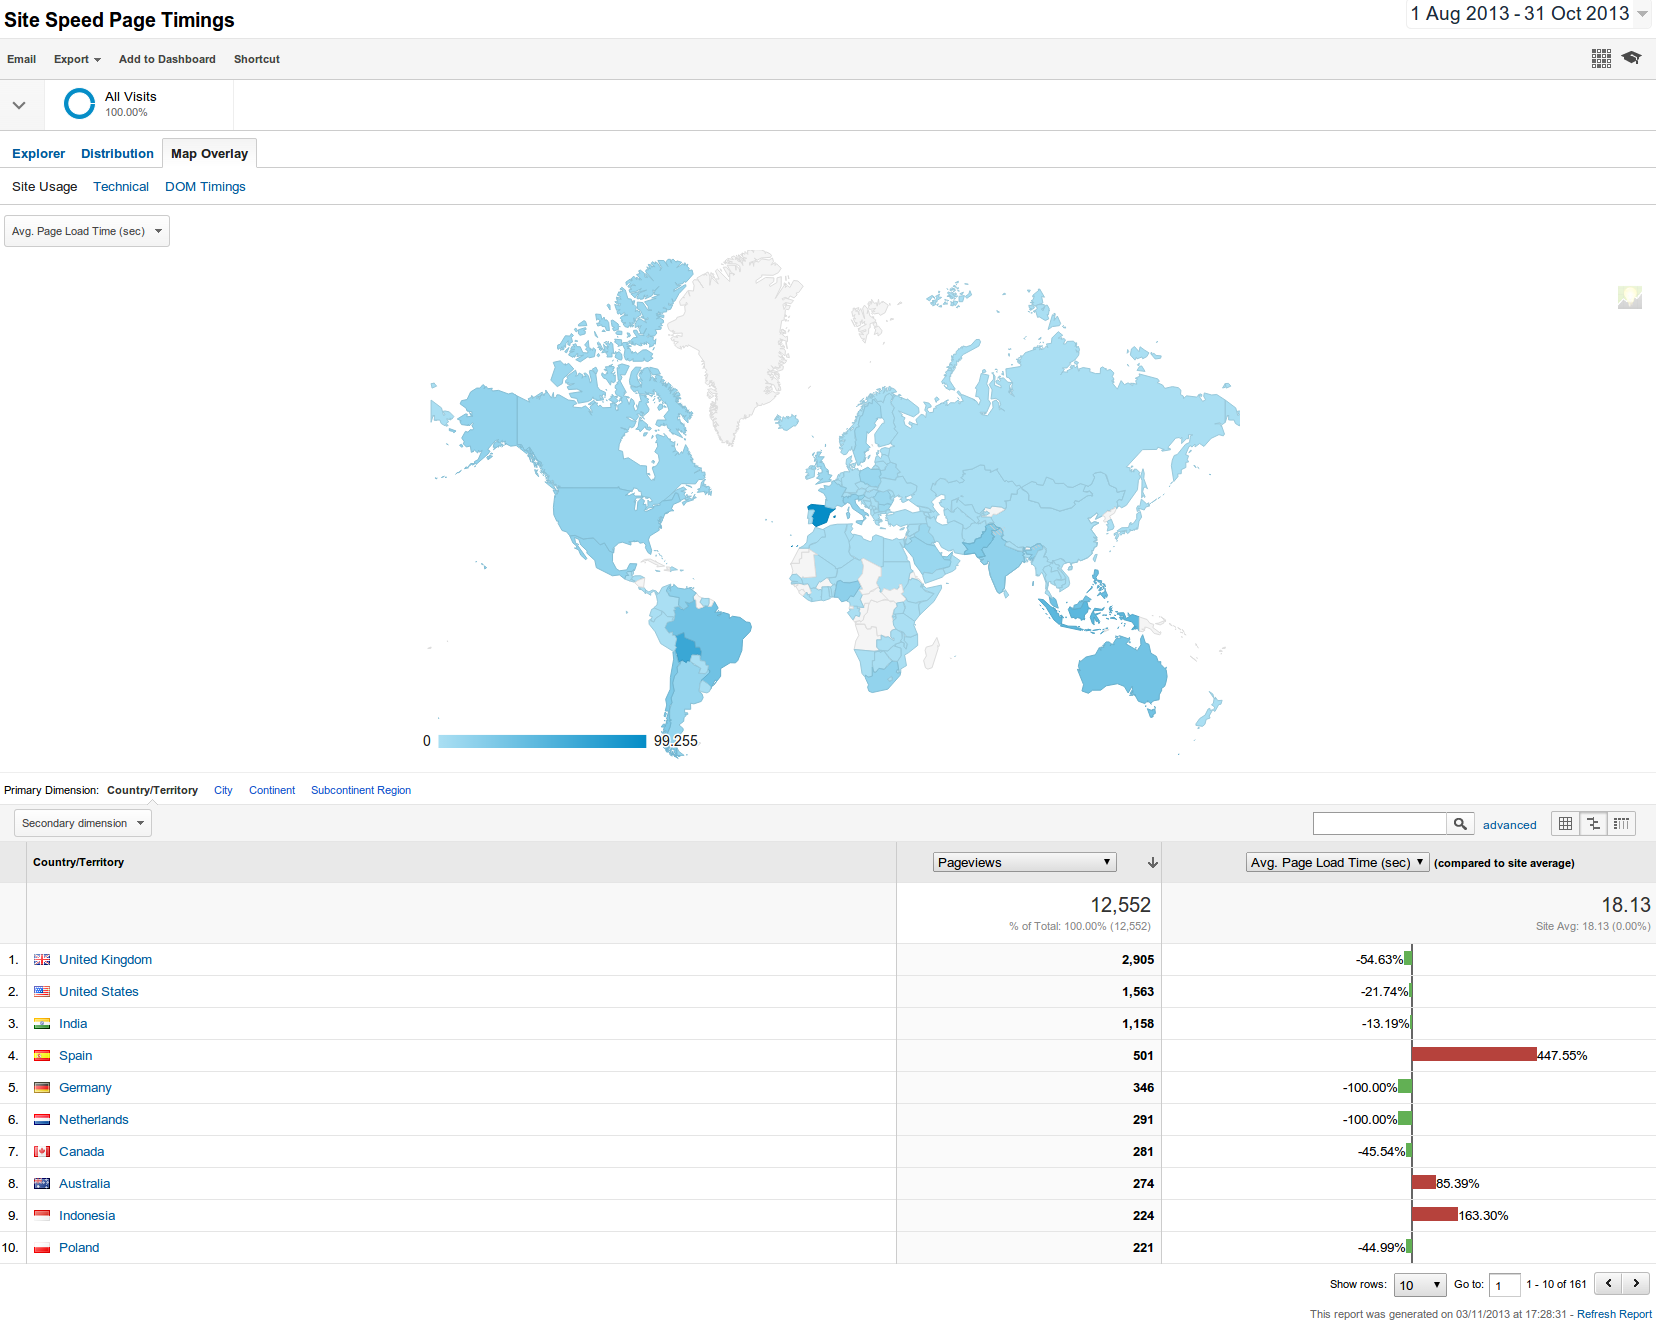
It is also possible to view this data with a map overlay - showing you which countries have problems with page load times.

This kind of insight can be helpful in identifying developing problems, however you should enlist a server administrator if you are managing your own servers, who can manage this using a purpose-built system such as the open source Nagios package.
Site Performance Dashboard
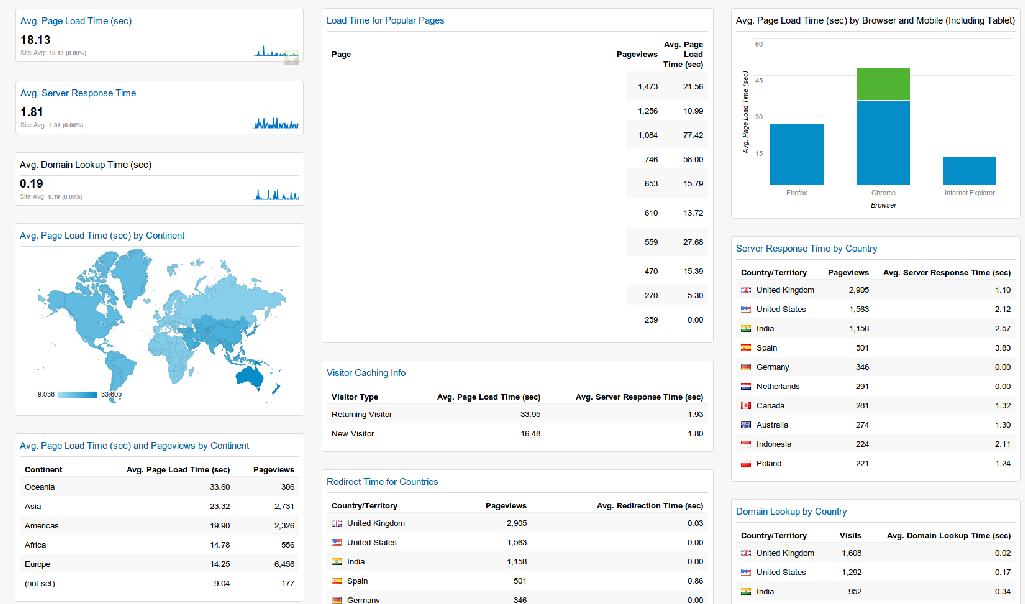
Like the other metrics, there is also a pre-built Site Performance Dashboard which you can drop into your Analytics account giving you all the key information. You can also add widgets to these dashboards, and tweak them to show in the format you prefer. They aren't set in stone.
